
Products Offered:
With WIFO tools it’s possible to model and test direction-neutral strategies that are based on risk management rather than prediction of the future. The strategies created with WIFO are the ones that produce reasonable but steady returns regardless of market conditions as opposed to technical strategies that lead to big wins and big losses.
WIFO Engine:
WIFO Engine is comprised of an online IDE and a set of backend components that
make it possible to model complex trading strategies.
With WIFO Engine you can:
WIFO Predefined Screens: What-if Screens feature predefined bullish and bearing signals, fundamental ranks, volality scans and option volume aggregates. Updated daily.
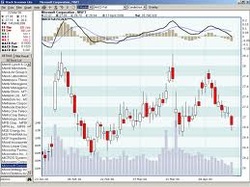
WIFO Charts: WIFO Charts is an interactive component for charting stocks, options, technical indicators, fundamentals, corporate events and implied volatility indices.
Highly customizable, WIFO Charts provide capabilities to chart:-
Stock prices and performanceOption prices and performance
Historical volatility
Implied volatility of individual options
Implied Volatility indices (VIX)
Corporate events such as dividends and splits
Fundamentals such as Net Income, EPS, PE and Profit Margin
Fundamental ranks in the sector, universe and market
Technical analysis indicators
In WIFO Charts it’s possible to attach calculations to any underlying chart. For instance, you can apply moving averages to stock prices, option prices, 1Q EPS, etc. You can even chain calculations by attaching calculation on top of calculation – for example, if you have Average True Range (ATR) applied to a stock price, you can then overlay a moving average on top of that ATR calculation. In the future version of WIFO Charts it will also be possible to create custom calculations by supplying a formula on top of the existing charts
With WIFO Engine you can:
- Setup
entry and exit conditions based on price action of stocks and options. Programmatically
evaluate risk exposure of a complex portfolio. Use
a library of technical analysis calculations in evaluating strategy entries and
exists. Apply
calculations to any data source being that a stock or an option price, a
fundamental metric, or even another calculation.
- Setup
fundamental filters based on metrics such as net income or filter out items based
on fundamental ranks by industry, sector or universe. Queue
your strategy based on proximity to corporate events such as earning releases,
dividends or splits. Setup
entry and exist conditions based on a result of market screens.
- If you are a C# programmer interested in testing financial strategies you are welcome to apply for our beta program that’s slated to start at the end of 2012. Being a beta user gives a preview of the capabilities of WIFO Engine. The most active beta testers will be awarded a free license when the software goes to production.
WIFO Predefined Screens: What-if Screens feature predefined bullish and bearing signals, fundamental ranks, volality scans and option volume aggregates. Updated daily.
WIFO Charts: WIFO Charts is an interactive component for charting stocks, options, technical indicators, fundamentals, corporate events and implied volatility indices.
Highly customizable, WIFO Charts provide capabilities to chart:-
Stock prices and performanceOption prices and performance
Historical volatility
Implied volatility of individual options
Implied Volatility indices (VIX)
Corporate events such as dividends and splits
Fundamentals such as Net Income, EPS, PE and Profit Margin
Fundamental ranks in the sector, universe and market
Technical analysis indicators
In WIFO Charts it’s possible to attach calculations to any underlying chart. For instance, you can apply moving averages to stock prices, option prices, 1Q EPS, etc. You can even chain calculations by attaching calculation on top of calculation – for example, if you have Average True Range (ATR) applied to a stock price, you can then overlay a moving average on top of that ATR calculation. In the future version of WIFO Charts it will also be possible to create custom calculations by supplying a formula on top of the existing charts
